|
 |
Know your feed supply curve
|
|
Understand the variability of your feed supply curve, within and between years
|
|
Identify and quantify opportunities to change your feed supply curve |
|
 |
Key decisions, critical actions and benchmarks
To better understand your feed supply, construct pasture supply curves for your property and assess the variability between years. This requires knowledge of your annual rainfall and its variability, temperature patterns and your pasture types.
Review annual rainfall patterns
Annual rainfall and its distribution influence pasture growth. To review your annual rainfall pattern, graph your own average, long-term rainfall figures, or to find long term rainfall information, visit the MLA Rainfall Outlook web site (www.mla.com.au/extension-training-and-tools/tools-calculators/rainfall-to-pasture-growth-outlook-tool/) or the Climate On-line web page at the Bureau of Meteorology website (www.bom.gov.au/climate/data/).
If you use Climate On-line choose the “monthly statistics” option, then your state and closest town, and click the plot icon to graph your Decile 5 median rainfall as shown in figure 8.1.
What does the annual rainfall pattern look like in your district? Can your existing pastures use the rain whenever it falls? Could pasture types with growth patterns different to those of your current pasture types fill some seasonal feed gaps in response to rain?

Figure 8.1
Median rainfall at Dubbo NSW (left) and Kojonup WA (right). Dubbo sheep
producers could grow green feed almost all year round in response to
rain, but this is much less likely at Kojonup with winter dominant
rainfall.
Determine your current pasture growth pattern
On any farm there may be several different pasture and feed sources (annual pasture, native or introduced perennial grass pastures, lucerne, grazing cereals, forage crops and crop stubbles) that can provide forage at different times of the year. Figure 8.2 shows the growth of lucerne and sub clover based pastures at Dubbo. Your total farm feed supply determines how well an enterprise and stocking rate will suit your growing season. However, it is important to also consider the quality of the pasture at different times of the year. For example, only a small area of lucerne might be required to grow out late winter born lambs in the Dubbo region.
There are several ways to use the pasture growth data. The first option is to plot on a graph similar to figure 8.2, the pasture growth of each of the main pasture types on your farm. This data together with information on the area of each pasture can be entered into the Feed Demand Calculator (see tool 8.3) to generate an overall supply curve for your farm. In addition, the tool allows you to trial different stocking rates, lambing times etc and determine pasture deficits or surpluses.

Figure 8.2
Pasture supply curves for Dubbo, NSW. Summer active pastures can extend the growing season and provide land management benefits (see procedure 5.3 in Protect Your Farm’s Natural Assets).
A second option is to manually work out the “average” pasture growth each month for your farm. See tool 8.2 for daily pasture growth estimates for common pastures by region. This is relatively easy where there are only 2-3 pasture types on a farm. For example, assuming that the data in figure 2 is from a 1000 ha farm with 800 ha sub clover pasture and 200 ha of lucerne, the average growth in January is: (lucerne 25 kg/ha/day x 200 ha) + (sub clover 5 kg/ha/day x 800 ha) / 1000 ha = 9 kg/ha/day average farm pasture growth in January. The same calculation can be undertaken for each month to determine the average pasture supply across the farm in an average year.
A third thing to consider is the potential to use alternative pastures or forage sources to fill feed gaps. For the farm shown in figure 2, what options are there to graze cereals or use pasture growth promotents in July? Is there potential to use more summer active pastures to overcome feed gaps in summer? Local state agency staff or agronomists can provide advice on species to fill feed gaps. Procedure 7.3 in Grow More Pasture also provides details of where to get information on pastures for different areas.
Finally, with the assistance of your consultant or adviser, use tools such as the computer model GrassGro® to get more specific data for your pasture species, soil types and soil fertility levels and how changes to these will influence pasture growth and quality.
Determine variability in your pasture growth
Pasture supply varies from year to year and between different locations. The variability of pasture growth between years is an indicator of risk and affects the ability to set an optimal stocking rate target or the reliability of a particular time of year for lambing (see figures 8.3 and 8.4).
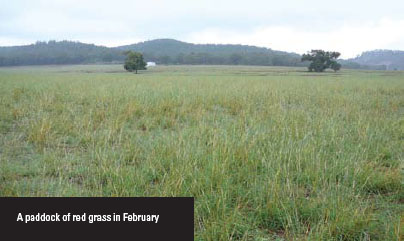
  Figure 8.4 Variability in annual pasture growth rates for Kojonup, WA (from DAFWA Woolpro sites and Pastures from Space) and native redgrass/sub clover pasture, Armidale, NSW (from GrassGro®).
In figure 8.4, Decile 1 represents the
one-in-ten bad years (only 10% of
all pasture growth records would fall
below this line). Decile 5 represents
an “average” year (half of the recorded
years were above and half were below
this line), while Decile 9 represents the
boom seasons (90% of all pasture growth
records would fall below this line) – only
10% of recorded year’s pasture growth
would be above this year.
The closer all three Decile lines are
together in any one month, the less
variability there is between years. In
figure 8.3, the most reliable months are
July-September at Kojonup. Autumn
growth in annual pastures is variable
at Kojonup, whilst spring is the most
variable growth period for native pastures
at Armidale.
To better understand your feed supply,
construct pasture supply curves for your
farm and assess the variability between
years.
The simplest approach to constructing
a pasture supply curve is to draw the
growth curves for the main pasture types
on a single graph.
Use the relevant tables in tool 8.2 to
construct simple pasture supply curves
for your farm. The estimates presented
are only intended as a guide to help
plan your annual feed availability. As an
example, a pasture supply curve has been
constructed for Dubbo NSW (figure 8.2)
using the tables in tool 8.2.
 Figure 8.4 Pasture supply curves for Dubbo, NSW. Summer active pastures in winter rainfall zones can extend the growing season and provide land management benefits (see procedure 5.3 in Protect Your Farm’s Natural Assets).
On your whole-farm pasture supply
curve, draw estimates of how much
higher these lines might be above the
average, in the 1-in-5 best years, and
how much lower the lines might be than
average, in the 1-in-5 worst years, using:
- Your experience, and/or that of your
adviser
- The Climate on line web page at the
Bureau of Meteorology website (www.bom.gov.au/climate/data) provides
historical weather details. In this site
click on “Weather & climate”, then
“Monthly statistics”. Enter your location
and select the nearest weather station to
your location. Get the data and then
select “All available” to see the Decile 1,
Decile 5 and Decile 9 rainfall values.
- The data in tool 8.2.
Alternatively, use tool 8.1 to calculate
an index of potential pasture growth,
based on actual rainfall, indices of soil
moisture, pasture growth for the past
nine months, and an outlook for the next
three months. Use this tool to get a ‘feel’
for when to expect pasture growth; to
establish where the likely deficits will be;
and to identify opportunities to include
different pasture types in your enterprise.
Tool 8.3 (the MLA feed demand
calculator), describes how best to match
animal demand to your pasture supply,
and minimise your exposure to risk from
seasonal variability. The feed supply
curve is generated as well as an inventory
of stock demand across the year (all
classes considering purchase, sale and
lambing dates). Compare supply with
demand to get a better understanding of
when pasture will be in surplus or deficit
and by how much. Use this information
to set up your enterprises to better match
available feed with animal demand.
Modify your pasture supply
Rainfall, temperature, soil moisture, soil type, fertility and pasture type combine to drive pasture growth. You can’t change your annual rainfall without moving, but you can rethink your existing pasture types and management systems to suit your location and achieve your enterprise goals.
Module 7 Grow More Pasture contains procedures to alter your pasture supply curves by:
Supply gaps by can be filled in several
ways. Use different pasture species and
forage crops to provide out of season
pasture growth. Figure 8.2 shows how
lucerne can fill a pasture supply gap over
summer/autumn in areas that receive
summer rainfall. Lucerne and other deep
rooted, summer-active perennials such
as chicory can also prevent potential
dryland salinity problems and protect the
soil (see procedure 5.3 in Protect Your
Farm’s Natural Assets).
Nitrogen fertilizer can be used to boost
pasture growth in winter and spring and
is often more cost effective than using
supplements. See Tool 7.4 Guidelines
for fertilizer applications for more
information.
Growth promotants that contain
Gibberellic acid can be used to boost
growth of pastures in winter when levels
of this naturally occurring plant hormone
are low. However, the additional growth
in winter may be at the expense of spring
growth. Information on how to fill the winter feed gap, including a tool to assess the likely response and cost effectiveness of using nitrogen and/or gibberellic acid can be found at www.evergraze.com.au/library-content/fill-the-winter-feed-gap/
Changes to grazing management can
also increase pasture growth. Rotational
grazing systems that allow higher pasture
availability during autumn and winter
can increase pasture growth rates by 10-
20% compared to set stocked systems.
For more information see www.mla.com.au/research-and-development/Grazing-pasture-management/improved-pasture/grazing-management/grazing-strategies/
Supplementary feeds can also be used
to fill feed gaps and harvesting hay or
silage can also use some of the excess
pasture available in spring. Ensure that
the supplements that you intend to use
are adequate for the class of stock being
fed. The Grazfeed program (www.hzn.com.au/grazfeed.php) or information
available through the Lifetime Ewe
course can assist in making better use of
supplements.
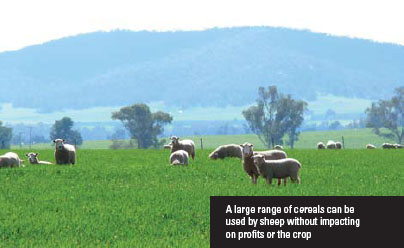
Utilise cereal crops
On mixed farming enterprises, crops can be another source of feed for livestock enterprises. A range of cereals can be utilized by livestock without impacting on profits or the crop. Across the southern states in the Grain & Graze project, benefits of grazing cereals to fill a feed gap are apparent. The Grain & Graze trial in Western Victoria (see signposts) showed grazing Yerong barley at the vegetative growth stages up to stem elongation:
- Had no adverse effect on eventual grain yield and even improved yield slightly
- Reduced stubble levels slightly, promising easier sowing in the following season
- Reduced the need to graze new or re-germinating legume pastures in early winter
- Gave 4-6 weeks grazing in the colder part of the year when pasture growth was slow
- Contributed 16% of the total feed requirement for the year.
 It is your total farm feed supply curve and its variability that indicates how well an enterprise might be suited to your growing season. Revisit your annual livestock management calendar (see procedure 8.2) and your business plan (tool 1.3 in Plan for Success) now that you know your feed supply and how it varies within and between years. It may be possible to address livestock needs with addition of other plant species to provide pasture of the quality and quantity required for the production goals (eg, growing out weaners, finishing lambs, etc). Alternatively, a more cost effective option is to revisit your enterprise structure (the number of breeders and trading stock carried), as well as reviewing your target market. For example, a better option in some locations without a summer feed supply, may be to sell lambs as stores, rather than taking them to heavier weights.
Signposts  |
Read
Drought Publications – The AWI website has a series of publications on managing drought recovery. visit: http://www.wool.com/. Click on Land > Drought Resources.
MLA’s More Beef from Pastures — the producer’s manual: eight modules and practical tools to build a more profitable beef business. The principles presented relate to using animals to convert pasture to liveweight be they sheep, cattle or goats. View online at: https://www.mla.com.au/extension-training-and-tools/more-beef-from-pastures/
Lifetime Ewe Course; this course provides details on management of ewes and managing feed gaps. Get more details from Rural Industries Skill Training https://rist.edu.au/ phone 03 5573 0943
Grain & Graze 2: The Grain & Graze 2 website has an archive of research material on grazing cereal crops along with farmer stories on optimising grain yield and livestock productivity through grazing crops. Visit: www.grainandgraze2.com.au/index.php
Climate Data Online: provides a range of statistics, weather observations and other climate data for Australian locations. Visit: www.bom.gov.au/climate/data
View
The MLA Rainfall to Pasture Growth Outlook Tool: estimates pasture growth for different locations across southern Australia. Visit the website: www.mla.com.au/extension-training-and-tools/tools-calculators/rainfall-to-pasture-growth-outlook-tool/
Climate On-line web page at the Bureau of Meteorology. Visit the website: www.bom.gov.au/climate/data
Pastures From Space: estimates weekly pasture growth rates and Feed on Offer. Pasture growth rates at the Shire level are free to access. Visit: www.pasturesfromspace.csiro.au
Attend
The MLA EDGEnetwork® program is
coordinated nationally and has a range of workshops to assist sheep producers. Contact can be made via:
Apps
Drought Feeding Calculator: available for ios and Android. Develops a drought feeding strategy for sheep (and cattle) by determining feed requirements for different sheep age groups and pregnancy/lactation status.
|
|