|
When conducting a water audit for your property you need to consider the various aspects to
water on your property that impact on the performance of the business. These are listed below:
Water source
On your map, you will need to list where the watering points and sources are, as well as their condition, and plans for improvement/refurbishment.
Investment in water infrastructure is not a cheap exercise, and can be time consuming, but it is an essential part of creating an effective grazing management system. There are many sources of water, and many methods of managing this valuable resource:
- Establishing systems for surface water collection in dams
- The development of bores
- Managing access to creeks or other natural water sources
- Increasing on-farm storage capacities
- Distributing water using poly pipe, tanks and troughs
- Upgrading existing systems e.g. upgrading windmills to solar pumps, changing open bore drains to piped reticulation systems, monitoring methods, etc.
- Use of telemetry and remote management systems.
- Similarly, operating, monitoring and maintaining water systems is an essential and costly part of property management.
A cost that is often less recognised, is the penalty cost caused by water issues:
- Limiting the ability of stock to access grazing areas due to water quality or insufficient watering points, or dry dams
- The quality of the water impacting on reproduction or wool and meat production
- Inefficiencies as a result of travel times to start pumps, or time taken to repair ageing systems and equipment
- Inefficiencies and costs associated with undertaking routine water runs, when this could be partly or entirely replaced in a cost effective manner with remote monitoring systems.
The benefits of having well planned water infrastructure in place are immeasurable. It allows stock to water adequately in times of peak demand, with little strain on stock, or the system.
Undertaking an audit of your farm’s water resources and stock water requirements is an exercise which can provide a high level of value in formulating your strategy for grazing management, as well as managing other limiting factors at critical times, for example labour and fuel for water runs. Use the opportunity to look into new technologies in water management, such as remote monitoring. The cost saving on labour, fuel and wear and tear may be offset by establishment of such a system.
Water quality
Water quality can directly impact on livestock performance, and it is important to understand the potential impacts of poor and good water quality. Knowing the quality of your water source can identify potential problems with livestock performance, and will help avoid unnecessary penalties from water quality issues.
Water testing services are available from private companies and a number of state agriculture and environmental departments.
Use one or all of the following components, to obtain accurate information about the status of your water supply. This may then feed into your business plan and improvement schedule.
Salinity tolerances of livestock
(James C and Bubb A, 2008) (Manitoba Agriculture Food and Rural Initiatives, 2006)
The following table provides a guide to sheep water intake levels.
Sheep water requirements
(Meaker et al. 2007)
These intake figures are ‘average’ figures and can be used on a planning basis to determine the levels of water storage required. Storage allowances also need to allow for:
- Wind ‘droughts’ when windmills may be ineffective and back-up pumping systems are required
- Seepage and high evaporation rates for surface catchment systems in the summer
- Lower than ideal in-flow into surface catchment systems due to poor seasonal rainfall
- Breakdowns or failures of pumps, and other water related equipment/infrastructure.
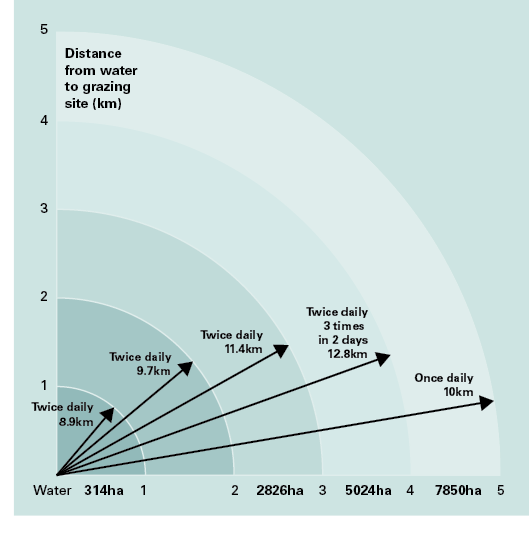
The following table provides a guide on the distances walked based on different water salinity levels:
Impact of water salinity on grazing area of sheep
(Western Australia Department of Agriculture, 2003)
* Grazing areas indicative only
Sheep grazing on saltbush commonly need to drink twice a day and have a reduced grazing range when compared to sheep grazing grasslands. Salty diets require additional water to flush the salt load from the sheep’s system (Squires 1981). When the water is saline, there is a significant reduction in the grazing radius and the utilisation of paddock feed.
Inventory of water sources
Maximum daily requirements
Remember to calculate each class of stock requirements separately, as, for example, lactating stock will require more than dry stock. Add up the requirements for each class of stock to calculate your maximum daily requirements.
Consider the requirements at key times of the year, such as summer and when stock are lactating.
It is advisable to use the maximum potential requirements, so as to plan in a fashion that will ensure that you have ample water at critical times. Water is a resource which you don’t want to underestimate your need for.
Writing down you maximum mob sizes is useful, as it allows you to compare your peak supply with demand for paddocks or mobs. This may illustrate potential weak points in your water management, and be useful in considering risk management plans or strategies.
Use tool 5.2 to prepare a basic water inventory.
http://www.makingmorefromsheep.com.au/protect-your-assets/tool_5.2.htm
|